Patient Size
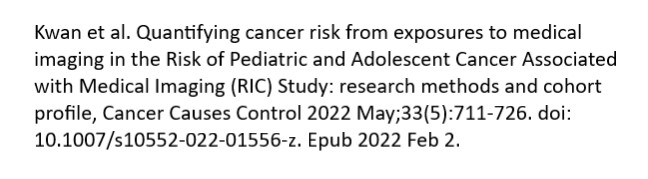
Radiation doses used for computed tomography will vary by patient size. Therefore measuring patient size is important and the measure takes into account patient size so that out of range scores are not influenced by patient size. The measure uses mid scan diameter to account for patient size. We have found mid-scan diameter is highly correlated with patient weight. In separate, NIH-funded research on CT use in children up to age 21 (Kwan 2022) we have shown that mid-scan diameter in 4,239 children as measured on mid-scan axial images is highly predictive of patient weight with a correlation= 0.904, Figure 1.

Figure 1. Mid scan patient diameter versus patient weight at the time of the CT Using data from Risk of Pediatric and Adolescent Cancer Associated with Medical Imaging (RIC) Study
For this eCQM measure, patient size is measured using CT image pixel data, either on the mid-scan axial image or the coronal scout image if the mid-scan axial image is not available or where the diameter cannot be measured on the image.
This approach has been validated using data from UCSF Health, the UCSF International CT Dose Registry, as well as the data assembled for measure testing across 16 hospitals and integrated outpatient ambulatory facilities.
While there may be different ways to measure patient size, and different reasons for measuring patient size, for the purpose of this measure it is a crucial piece of information that must be practically defined to ensure that the types of patients seen at different practices (case-mix) does not bias or influence the number of scans that are graded as out-of-range. We are adjusting for patient size primarily to ensure that entities that see larger patients are not penalized for doing so.
Figure 2a shows the relationship between radiation dose (in Dose Length Product, DLP) and patient diameter using data from the UCSF International CT Dose Registry for Abdomen and Pelvis CT. We chose to illustrate this with Abdomen and Pelvis CT as this is the category most influenced by patient size, and where patient mix could impact a reporting entity’s out-of-range score.
The raw correlation between patient diameter and unadjusted DLP is 0.50, and the marginal R-squared of the log-linear model used for adjustment is 0.15 (Figure 2a) . After size-adjustment, the relationship is nearly removed. Figure 2b shows size-adjusted DLP by patient diameter using the same data; the raw correlation is far lower -(0.09), and the modeled marginal R-squared post-adjustment is 0. This demonstrates adequacy of the approach for adjustment of patient size for the purpose to accounting for case mix across reporting entities.
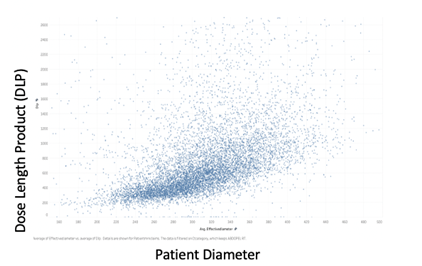
Figure 2a. Dose Length Product versus Patient Diameter
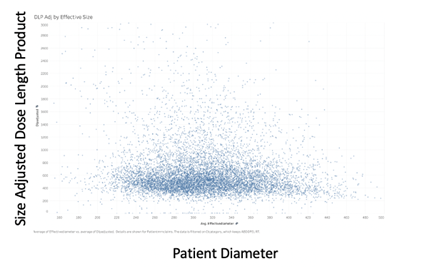
Figure 2b. Size-Adjusted Dose Length Product vs. Patient Diameter
The adequacy of size adjustment was shown empirically using data assembled from the testing sites. Out-of-range proportions for routine abdomen exams at 16 hospitals in the testing data based on unadjusted DLP, by decile in patient size, are shown in Table 1a. The proportion of out-of-range exams increased with patient size, seen in the table as an increase in dark shading in the lower rows of the table. Among patients in the highest size decile – those in last row– the out-of-range proportions across the 16 hospitals ranged from 93-100%. This highlights the need for adjustment for patient size.


The out-of-range rates for these same patients based on adjusted DLP (as specified and used in the measure) are shown in Table 1b. High proportion of out-of-range exams are no longer concentrated among the larger patients. Among patients in the highest size decile, out-of-range rates ranged from 11-53%. Essentially larger size is no longer predictive of a patient having an out of range value.